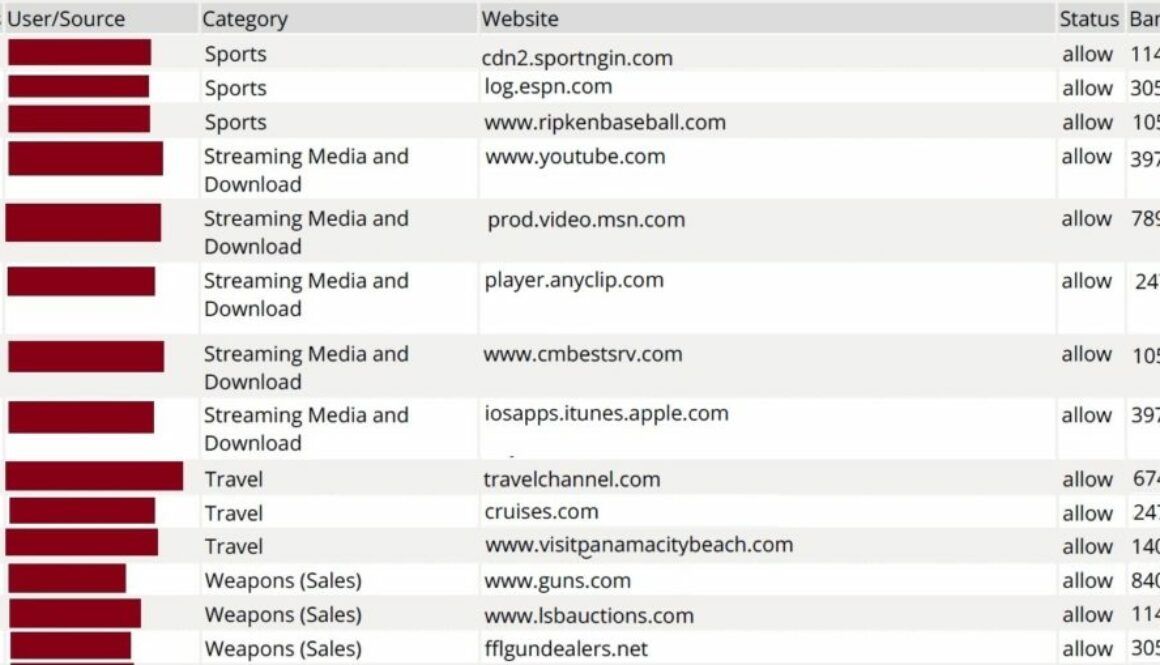
FortiAnalyzer custom report – All users web browsing by category
I recently spent time building FortiAnalyzer reports to let management see which devices are spending the most time browsing non-work websites. I was really surprised how hard it was to find information on this topic. No default reports on the FortiAnalyzer gave the level of detail I wanted without running the User Detailed Browsing Log over and over for each device and scanning through thousands of logs. Ended up writing custom queries and doing it the hard way. My loss is your gain.
There are a few major caveats that I have to go through with you first:
- FortiAnalyzer has no way of telling whether traffic logs are generated by a user or by a background process on the device. For example; if you see a device, let’s call it 192.168.100.28, making connections to a botnet in China, it is good odds that malware is doing the talking, not the user.
- Without special agents configured, FortiAnalyzer has no way to tell which USER is logged on to a device. If you see 192.168.100.28 connecting to porn websites at night, you may want to verify who was actually sitting at the keyboard before going on a firing spree.
- The “Requests” column really refers to the # of traffic logs generated. In my limited review, it seems like a new connect log is generated about once a minute during active browsing. So I use this to distinguish between a quick connect (for example, to download pictures or advertisements on a linked page) and a long browsing session. The custom reports are set to filter single requests, dramatically reducing the number of pages.
- The “Bandwidth” column is exactly as it seems. If nothing else, goofing off on social media or YouTube does hog bandwidth from other legitimate users.
- In my custom report, I filtered out categories that seem like normal work web browsing or data transmissions to/from vendors: Reference, Information Technology, Search Engines and Portals, Web Hosting, Business, Government and Legal Organizations, Information and Computer Security. I also filtered out Advertising because otherwise it is about half the report, and normally users don’t choose to view advertising on purpose.
Selfish plug time (sorry!)
I hope this article helps you (don’t worry, the next section has the FortiAnalyzer code you are seeking). If you have tips or feedback, please comment or send me an email so that others can benefit. I am a consultant in the Maryland/DC area in the USA. My specialties are Windows migrations (to 2016 and to Office 365 / Azure), VMware migrations, Netapp and SAN, and high availability / disaster recovery planning. If your business would like help with your complex project, or would like a architectural review to improve your availability, please reach out! More information and contact can be found on the About page. – Amira Armond
How to create the first custom FortiAnalyzer report “ALL USERS BY CATEGORY”:
Note: The code works well on FortiAnalyzer 5.4.3. If you have syntax problems on other versions, review the “Top Web Users by Allowed Requests” dataset to verify your table and column names.Create a new dataset named “ALL USERS BY CATEGORY”
Log type = Traffic Query = select sum(minutes) as CountTimeStamps, user_src, catdesc, hostname as website, status, sum(bandwidth) as bandwidth from ###(select count(dtime) as minutes, coalesce(nullifna(`user`), nullifna(`unauthuser`), ipstr(`srcip`)) as user_src, catdesc, hostname, cast(utmaction as text) as status, sum(coalesce(sentbyte, 0)+coalesce(rcvdbyte, 0)) as bandwidth from $log-traffic where $filter and hostname is not null and logid_to_int(logid) not in (4, 7, 14) and (countweb>0 or ((logver is null or logver<52) and (hostname is not null or utmevent in (‘webfilter’, ‘banned-word’, ‘web-content’, ‘command-block’, ‘script-filter’)))) group by user_src, catdesc, hostname, utmaction)### t group by user_src, catdesc, website, status having sum(minutes) > 1 order by catdesc, CountTimeStamps DESC Apply…Create a new Chart named “ALL USERS BY CATEGORY”
- Select dataset = ALL USERS BY CATEGORY
- Resolve hostname = Inherit
- Chart type = table
- Change counttimestamps to “Requests (minutes”) and width = 5%
- Change user_src to “User/Source” and width = 14%
- Change catdesc to “Category” and width = 20%
- Change website to “Website” and width = 0%
- Change bandwidth to “Bandwidth” and width = 6% and change the binding for this field to “Bandwidth (KB/MB/GB”
- Order by = unchecked
- Show Top (0 for all results) = 0 **Double check this one**
Create a new report:
Create from Blank, named “ALL USERS BY CATEGORY” Go to Layout tab > Insert Chart >- Select the ALL USERS BY CATEGORY chart.
- Title = Default
- Width = 700
- Log Field = Category Description (catdesc)
- Match Criteria = Not Equal To
- Value = type “Advertising” and press Enter. Now add the rest of the categories, pressing enter between each one.
- Advertising
- Reference
- Information Technology
- Search Engines and Portals
- Web Hosting
- Business
- Government and Legal Organizations
- Information and Computer Security

