Upgrade your computer management for the New Year! Businesses in our service area (between Rockville, Frederick, and Baltimore) can reference this advertisement for a free service visit (approx 1.5 hours) to fix small problems and talk about long term goals.
Small and medium businesses struggle with their IT departments. They either can’t afford the salary for a full time person at all, or the one(s) they hire don’t have the experience to grow the network as the company grows. Hiring an IT services business (like Kieri Solutions) is the solution for these businesses. At the budget end, for $800 a month, a small office can get preventative system checks, backups, security patches, and help with common computer issues. Larger businesses can get senior project management, on-call support, a full security program, helpdesk, and a host of other services for about the cost of one full time employee.
We are active supporters of local small businesses, particularly woman entrepreneurs! We proudly offer training on technical topics to current and future business owners through the Maryland Women’s Business Center, and also offer training events to all entrepreneurs a few times a year. If you are interested in training, send us an email at info@kieri.com and we will let you know the next opportunity. We are all in this together, so let’s succeed together!
This is a story about how we migrated a production server from RAID-1 to RAID-5 without losing data, using the PERC H730 controller.
Recently, we pushed a Dell server’s PERC RAID controller to its limit. (After making a verified good backup, of course).
Originally, the server’s hard drives were set up as a RAID 1 with two disks.
We added 3 more drives and wanted to switch the scheme to RAID 5 without losing data.
The steps:
Reboot, go into BIOS (F2)
Device Settings
Select the RAID Controller H730P Mini PERC Configuration Utility
Virtual Disk Management, then in the Operation area “Reconfigure virtual disks”
Raid level 5.
At this point, we were prompted to select physical disks, so I selected the new ones. A warning appeared that data would be erased on these disks (the new disks). Okay.
Continue through (Finish) and a statement appears that the reconfiguration has started and you can check the status to see when it finishes.
When we refreshed the menu for Virtual Disk Management, we saw the reconfiguration slowly processing. It took about 15 minutes for the first 1%.
25 hours to finish reconfiguration…
We don’t have time for this! This server needs to be back online!
So… we exited the BIOS, which restarted the server. Then into Windows!
We were pretty sure it would work, and it did. The modern PERC controller can handle reboots while it is rebuilding…
Spent the weekend troubleshooting a website error on Dreamhost with the Shared Hosting Plan.
Symptoms
Media files (pictures) larger than 2mb were spontaneously disappearing from the media library.
When uploading, large files would get the vague “HTTP error” in WordPress.
The thumbnail would be blank, and you couldn’t see the picture if you edited it.
The browser error console (right-click the page and Inspect Element) showed async-upload.php terminating with a 404 error.
The error log in the website itself (use SFTP to browse the /logs/ directory and open the error.log) says “Premature end of script headers errors for async-upload.php”
It gets worse over time.
Performing the standard fixes in php.ini , or phprc.ini , or .htaccess does not fix the media library at all.
I am carefully managing the picture sizes on my hosted websites now, with a goal of using images with (approximately) 1600×1000 resolution, or sub-200k size. These images look great on a computer screen and seem to stay well within the Dreamhost memory limits. So far I haven’t had any issues since making this chance. The trickiest part is finding a user-friendly way to compress the images, especially when customers are authoring content.
Solution: Frustratingly, to get this alarm to go away, you do need to add hard drives to the licensed limit (3.5 TB in my case). I could not find any way to clear or acknowledge the alarm.
BUT, if you are using a virtualization solution, you CAN use thin provisioning to keep the size low. Don’t worry, when you configure your quota limits in the next section, you can set how much disk space will be used.
To do this, shut down the FortiAnalyzer. Add the virtual hard drives using your virtualization manager. Turn the FortiAnalyzer back on. Once it finishes booting, log onto the admin website and access the CLI window.
Enter command execute lvm extend . Reboot again if told to.
But… you will still have a problem with log retention…
The next configuration problem with the FortiAnalyzer virtual appliance: Quota limits
FortiAnalyzer does not automatically allocate available disk space for log storage.
Symptom: When you try to run reports, there is very little historical data. Or no data from yesterday or before.
Symptom: FortiAnalyzer is overwriting old report data.
Symptom: You have to run a report from the last few hours to get a result.
This is because the quota is tiny, so the device is automatically overwriting historic logs.
In the event log on a newly deployed appliance, you will see these errors:
“Quota for adom root has reached 90 percent of total 1000(MB)”
The Fix:
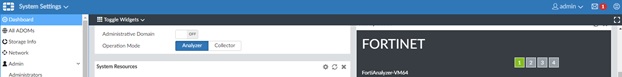
Go to System Settings > Storage Info > Edit Root > change maximum allowed disk from 1000 MB to slightly less (or equal to) your “Out of Available” total. For example, you might change this value to 2.8 TB. If you don’t want to use your entire disk ( for example, you thin provisioned it to 3.5 TB but only want to use 1TB), then set the Maximum Allowed to 1 TB.
Other setup that isn’t addressed in the quick start guide…
I recently spent time building FortiAnalyzer reports to let management see which devices are spending the most time browsing non-work websites. I was really surprised how hard it was to find information on this topic. No default reports on the FortiAnalyzer gave the level of detail I wanted without running the User Detailed Browsing Log over and over for each device and scanning through thousands of logs. Ended up writing custom queries and doing it the hard way. My loss is your gain.
There are a few major caveats that I have to go through with you first:
FortiAnalyzer has no way of telling whether traffic logs are generated by a user or by a background process on the device. For example; if you see a device, let’s call it 192.168.100.28, making connections to a botnet in China, it is good odds that malware is doing the talking, not the user.
Without special agents configured, FortiAnalyzer has no way to tell which USER is logged on to a device. If you see 192.168.100.28 connecting to porn websites at night, you may want to verify who was actually sitting at the keyboard before going on a firing spree.
The “Requests” column really refers to the # of traffic logs generated. In my limited review, it seems like a new connect log is generated about once a minute during active browsing. So I use this to distinguish between a quick connect (for example, to download pictures or advertisements on a linked page) and a long browsing session. The custom reports are set to filter single requests, dramatically reducing the number of pages.
The “Bandwidth” column is exactly as it seems. If nothing else, goofing off on social media or YouTube does hog bandwidth from other legitimate users.
In my custom report, I filtered out categories that seem like normal work web browsing or data transmissions to/from vendors: Reference, Information Technology, Search Engines and Portals, Web Hosting, Business, Government and Legal Organizations, Information and Computer Security. I also filtered out Advertising because otherwise it is about half the report, and normally users don’t choose to view advertising on purpose.
Selfish plug time (sorry!)
I hope this article helps you (don’t worry, the next section has the FortiAnalyzer code you are seeking). If you have tips or feedback, please comment or send me an email so that others can benefit. I am a consultant in the Maryland/DC area in the USA. My specialties are Windows migrations (to 2016 and to Office 365 / Azure), VMware migrations, Netapp and SAN, and high availability / disaster recovery planning. If your business would like help with your complex project, or would like a architectural review to improve your availability, please reach out! More information and contact can be found on the About page. – Amira Armond
How to create the first custom FortiAnalyzer report “ALL USERS BY CATEGORY”:
Note: The code works well on FortiAnalyzer 5.4.3. If you have syntax problems on other versions, review the “Top Web Users by Allowed Requests” dataset to verify your table and column names.
Create a new dataset named “ALL USERS BY CATEGORY”
Log type = Traffic Query = select sum(minutes) as CountTimeStamps, user_src, catdesc, hostname as website, status, sum(bandwidth) as bandwidth from ###(select count(dtime) as minutes, coalesce(nullifna(`user`), nullifna(`unauthuser`), ipstr(`srcip`)) as user_src, catdesc, hostname, cast(utmaction as text) as status, sum(coalesce(sentbyte, 0)+coalesce(rcvdbyte, 0)) as bandwidth from $log-traffic where $filter and hostname is not null and logid_to_int(logid) not in (4, 7, 14) and (countweb>0 or ((logver is null or logver<52) and (hostname is not null or utmevent in (‘webfilter’, ‘banned-word’, ‘web-content’, ‘command-block’, ‘script-filter’)))) group by user_src, catdesc, hostname, utmaction)### t group by user_src, catdesc, website, status having sum(minutes) > 1 order by catdesc, CountTimeStamps DESC Apply…
Create a new Chart named “ALL USERS BY CATEGORY”
Select dataset = ALL USERS BY CATEGORY
Resolve hostname = Inherit
Chart type = table
(The columns should auto-populate)
Change counttimestamps to “Requests (minutes”) and width = 5%
Change user_src to “User/Source” and width = 14%
Change catdesc to “Category” and width = 20%
Change website to “Website” and width = 0%
Change bandwidth to “Bandwidth” and width = 6% and change the binding for this field to “Bandwidth (KB/MB/GB”
Order by = unchecked
Show Top (0 for all results) = 0 **Double check this one**
Apply…
Create a new report:
Create from Blank, named “ALL USERS BY CATEGORY” Go to Layout tab > Insert Chart >
Select the ALL USERS BY CATEGORY chart.
Title = Default
Width = 700
Filters = (Click + to add a filter)
Log Field = Category Description (catdesc)
Match Criteria = Not Equal To
Value = type “Advertising” and press Enter. Now add the rest of the categories, pressing enter between each one.
Advertising
Reference
Information Technology
Search Engines and Portals
Web Hosting
Business
Government and Legal Organizations
Information and Computer Security
Apply and run the report using the last 10 hours or so. You should get something like the picture at the top of this blog. Note: If you have more than 10,000 lines in the report, it will cut off. Report across fewer hours if this happens.
How to create the second custom report “ALL USERS BY USER ACTIVITY”:
Note: The code works well on FortiAnalyzer 5.4.3. If you have syntax problems on other versions…
GDPR stands for General Data Protection Regulation (Regulation (EU) 2016/679).
Who does it apply to? Any organization (non-profit, for-profit, government) which controls or processes data belonging to EU residents.
When does it happen? The regulation goes into effect 25 May 2018. 9 months away.
What is it? 11 chapters and 99 articles of laws governing how data is collected, processed, protected, distributed, requested, transferred, provided, and deleted.
Overview of regulation: You must catalog the location and flows of all regulated data, both in your organization and in vendor/partner organizations. Then you must create technical processes to handle regulated situations, such as opt-in permission before collecting data; a customer requesting a copy of all held information; a customer requesting a deletion of all their information; or a regulator requesting proof that you performed these actions. Then you must test and train these processes to ensure they work in an efficient manner.
Why was it enacted? As a fix. The last significant legislation on the topic was from 1995—before the introduction of the Internet and cloud computing changed the way our data is used.
What you need to do
Determine if GDPR applies to your organization.
Do you have EU resident data in your system?
Your company sells goods or services to EU customers.
You are an IT provider. Some customers store regulated data on your servers.
Your marketing department has web analytic data and customer databases which includes the EU.
You run a popular website which sends out newsletters and hosts discussion forums.
Determine if you need help with this task.
Do your current staff have the time, knowledge, technical skill, and process development background to make your organization compliant before May 2018?
Start now. May is coming up!
Consultant? Consider Kieri Solutions
Amira Armond, the president and CEO of Kieri Solutions, has the precise experience needed to prepare your organization for GDPR.
Technical: 15 years of experience with servers, networking, databases, websites, and system integration. As systems architect, holds an understanding of the entire organization’s computer systems and data flows.
Process: Certified Project Management Professional, with a Masters in Business. During her career, she has created thousands of technical procedures and lead the implementation of new systems.
GDPR: Has studied the hundreds of pages of regulation and understands (as best as any one can) the requirements and necessary actions.
Contact us for a free data flow analysis and plan: info@kieri.com 1-(301) 253-5150
This worm’s name was Welchia, and it came into the world late one night in mid-2003.
I was early career IT at that time, working Tier 2 Helpdesk in a very large (hundreds of thousands of users) enterprise. We had server farms across the world and I did normal things like resetting user profiles, fixing file shares, and repairing programs.
One morning, I was managing a server overseas when it abruptly went offline. I tried to reach the other servers at that site and none of them responded. Other employees around me confirmed that the network link was down.
About one minute later, I lost my connection to the server farm on the west coast. At this point, we started to get alarmed.
Then a few seconds later, server farms in the mid-USA went offline.
We are now in full panic mode. Is this World War III? Are we under attack?
And then two things happened simultaneously – our own computers lost connection to…
You increased the size of a datastore in the past, but now when you open vCenter, you see the old (smaller) size displayed. There may be low disk space warnings.
Web client for vCenter 6.5 and vSphere 6.5 and probably vCenter 6.0 and vSphere 6.0
If you refresh the datastore information, the correct size displays and the warnings go away temporarily.
The problem re-occurs.
Root Cause
According to the VMWare forums, this is caused by having different ESXi versions on the hosts in the datacenter. Such as one host has Update 1 and another host has Update 3. The recommended fix is to simply update all ESXi to the same version.
What happens if you can’t?
In my case, I needed to use a custom HP image for some servers, and I’m not going to take down the other hosts to install that custom image. So I kept trying things and found a good workaround.
Workaround
For EACH host in the datacenter that had a connection to the faulty storage, I performed these steps:
Had to troubleshoot a few HP DL360 servers recently during a vSphere upgrade.
They refused to upgrade to vSphere ESXi 6.5 with a conflicting_vibs_error
Symptoms:
After selecting “Upgrade ESXi and preserve the existing datastore”, the system scan presented the following error:
<CONFLICTING_VIBS ERROR: Vibs on the host are conflicting with vibs in metadata. Remove the conflicting vibs or use Image Builder to create a custom ISO providing newer versions of the conflicting vibs.
[‘qlogic_bookbank_scsi-qla2xxx_……..’
‘Emulex_bootbank_scsi-lpfc820_……..’
‘QLogic_bootbank_scsi-qla4xxx_……..’
‘VMware_bootbank_net-nx-nic_……..’
‘Intel_bootbank_net-ixgbe_……..’
‘Brocade_bootbank_scsi-bfa_……..’
At that point, I researched and found that this error is because the server was originally installed with a custom image from HP. Good news though, HP and VMWare have a new custom vSphere ESXi 6.5 image available for a host of HP servers, including the DL360p G8.
Note: This image works on the following models per the documentation… HPE Synergy 480 Gen 9, Synergy 620 Gen 9, Synergy 660 Gen 9, Synergy 680 Gen 9 | Moonshot m510, Moonshot m710x | Proliant Microserver Gen8 | BL460c Gen8, BL460c Gen9, BL465c Gen8, BL660c Gen8, BL660c Gen9 | DL20 Gen9, DL60 Gen9, DL80 Gen9, DL120 Gen9, DL160 Gen8, DL160 Gen9, DL180 Gen9, DL320e Gen8 v2, DL260 Gen9, DL360p Gen8, DL380 Gen9, DL380p Gen8, DL385p Gen8, DL560 Gen8, DL560 Gen9, DL580 Gen8, DL580 Gen9 | ML30 Gen9, ML350 Gen9, ML150 Gen9, ML110 Gen9 |
Also found that the iLO vib is a problem in that image (causes purple Screen of Death) – make sure you download the latest iLO vib and install it after upgrade.
Attempted again with the new custom image, SAME ERROR! But at this point, I knew that I could download any of the vibs after upgrading, so I removed them from the server using these steps:
Identify the vib short name by reviewing the error message. The text where the hyphens start is the vib short name (example in bold). ‘qlogic_bootbank_scsi-qla2xxx-934.5.20.0-10EM.500.0.0.472560′
Console into the ESXi server
Run command esxcli software vib remove -n <vibShortName>
Repeat for each offending vib
Attempt upgrade again (this time it should work)
After upgrade, verify that your hardware is working, all NICs are good, etc.
Make sure to install the iLO vib by copying it to the server’s /tmp/ directory (recommend using WinSCP for this), then run command esxcli software vib install -v /tmp/ilo_vibname.vib
Reboot the server to finish activating the iLO vib.
Hope this works for you as well as it worked for me. Good luck folks!
This is an inside joke for IT professionals. It refers to job security. If you are the only person who has the keys, your management will think twice before they fire you. With that level of job security, you can close the door and go back to playing computer games.
As a business owner, you need to stay in control of your computer system! The best way to do this is to demand documentation and account best practices from your computer staff.
Standard IT department documentation should have this information (at minimum):
A visual diagram of major systems (such as servers, network equipment) listing their purpose, how they are connected, and network addresses to administer them.
“Administrator” level usernames and passwords for each piece of network equipment, server operating system, and major application (such as your website and email).
Printouts or backups of configurations for each major program and equipment, so that if your IT guy gets run over by a bus (or quits suddenly), a new person can see how it should work.
Account best practices should be followed:
If a system allows you to create more than one administrator account, each IT staff should have their own account, named to identify the owner (example: jsmith).
Generic “administrator” or “root” accounts should not be used if named accounts are available.
Generic “administrator” or “root” accounts should have unique, complex passwords that few people know.
These two best practices are important for protecting yourself against criminal IT people as well as outside hackers.
Here are four reasons why:
Access logs can be reviewed periodically or after a security incident to see which account performed the action. Generic accounts always leave the question of “who was actually logged on?”
IT people are much less likely to do improper things if their personal account is associated with it.
If an IT person leaves the company, you can disable their personal accounts easily without hurting anything.
And you are more likely to notice if new administrator accounts are created, or there is unusual access by the “administrator” / “root” account (symptoms of outside hackers).